wasmtime, IntelPIN and a lot of traces
Software Diversity for WebAssembly
In our laboratory, I specialize in Software Diversification. This involves the generation of multiple semantically equivalent variants from a single original program. Specifically, both the original program and any of its variants should yield the same output when given the same input. Our focus is primarily on diversifying WebAssembly.
There are several ways to evaluate the level of diversity achieved. The most immediate method involves static analysis, where a variant is considered a diversified version of the original program if it exhibits structural differences. However, there may be instances where, despite the binaries being different, the execution behavior remains unchanged. An example of this might be a variant that merely alters the location of variable allocations. Though it differs from the original, compiler normalization may result in identical executed code. So, how do I evaluate dynamic diversity? Typically, I do this by examining program traces.
Assessing Software Diversity for WebAssembly
To assess diversification in WebAssembly, in the past, I have an interpreter that adheres to the virtual machine specification. In practice, I trace the stack and memory operations of the WebAssembly code, comparing the traces between the original program and its variants. If the traces are different under the same input, then the original program and the variant are behaviorally different.
I’ve recently shifted our approach to a more realistic scenario, choosing to gather the execution traces of WebAssembly programs as they operate in real-world situations. Specifically, I aim to gather the most detailed execution traces of WebAssembly programs as they run with wasmtime.
Wasmtime is a high-performance WebAssembly compiler at the heart of revolutionary Function as a Service platforms. As a host, it processes input WebAssembly code, compiles it into machine code (it can also function as an interpreter), and executes the newly generated machine code. To gather the execution traces of a WebAssembly program run with wasmtime, one must pinpoint the machine code that directly originates from WebAssembly. I employ IntelPIN for this task.
IntelPIN
In order to collect the execution traces of WebAssembly programs run with wasmtime, one needs to implement a Pintool. A Pintool is a program analysis tool that we’ll create using IntelPIN’s dynamic binary instrumentation framework, allowing us to observe and manipulate the execution of the program at the instruction level. However, the execution traces currently include substantial non-WebAssembly related data, such as all the operations performed by wasmtime itself. I refine these traces to filter out the extraneous information. Fortunately, wasmtime offers a feature that will be of great help: it can detect when program execution transitions between WebAssembly and the wasmtime host. To illustrate how these hooks are used, take a look at the following Rust code snippet:
store.call_hook(|t, tpe|{
    match tpe {
        // The  code will jump out of the Wasm program
        wasmtime::CallHook::CallingHost => {},
        // The code will jump to non Wasm
        wasmtime::CallHook::ReturningFromHost => {}
        _ => {}
    }
    Ok(())
});
Implementing this strategy allows us to direct the Pintool to pause and restart the collection of instruction traces only when WebAssemly related code is executed. To facilitate this, I set up a simple mechanism for interfacing with the Pintool. At the outset of Pintool execution, I establish a shared memory space where a boolean variable is stored. If trace collection is permissible, this variable is set to true, and false` otherwise. This procedure effectively breaks down into two primary components: the shared memory access and the writing to it from the wasmtime host code.
Below, you can see the code used for accessing shared memory. Although it’s written in C, it can be incorporated at compile-time into the Rust binary.
#include "common.c"
void attach() {
    // This is different for macos

    int shmid = shmget(SHARED_MEMORY_KEY, sizeof(SharedLock), 0);
    if (shmid == -1) {
        return;
    }
    sharedVal = (SharedLock*)shmat(shmid, NULL, 0);
}
// Set the lock to open or close to interrupt the recording of the traces
int set_lock(char val) {
    sharedVal->lock = val;
    return 0;
}
Then, the first Rust code snippet is turned to.
store.call_hook(|t, tpe|{
    match tpe {
        wasmtime::CallHook::CallingHost => {
            unsafe {set_lock(0)};
        },
        wasmtime::CallHook::ReturningFromHost => {
            unsafe {set_lock(1)};
        }
        _ => {}
    }
    Ok(())
});
Validating our Pintool
I conduct an evaluation of our filtering mechanism using the Deadpool tool, which can be found at https://github.com/SideChannelMarvels/Deadpool, paired with a whitebox cryptography challenge that has been ported to WebAssembly. Deadpool employs Differential Computing Analysis to extract keys from whitebox encrypted programs.
The success of this tool is heavily dependent on execution traces. Consequently, the precision of our technique is paramount to successfully extracting keys using Deadpool and our WebAssembly execution traces. In scenarios where our filtering method is not applied, the Deadpool tool fails to operate effectively under the proposed configuration due to the overwhelming abundance of traces.
Our aim is to prove the effectiveness of our filtering mechanism by operating the Deadpool tool on traces harvested solely from WebAssembly execution. If the Deadpool tool manages to successfully extract the key post-filtering, it will serve as irrefutable proof that our mechanism is functioning as designed.
Upon running this straightforward experiment, Deadpool succeeds in exfiltrating the key using its initial configuration. Therefore, the technique seems to bring fruits, it can be used to assess dynamic diversity.
The image below illustrates the trace plot after the application of our filtering process.
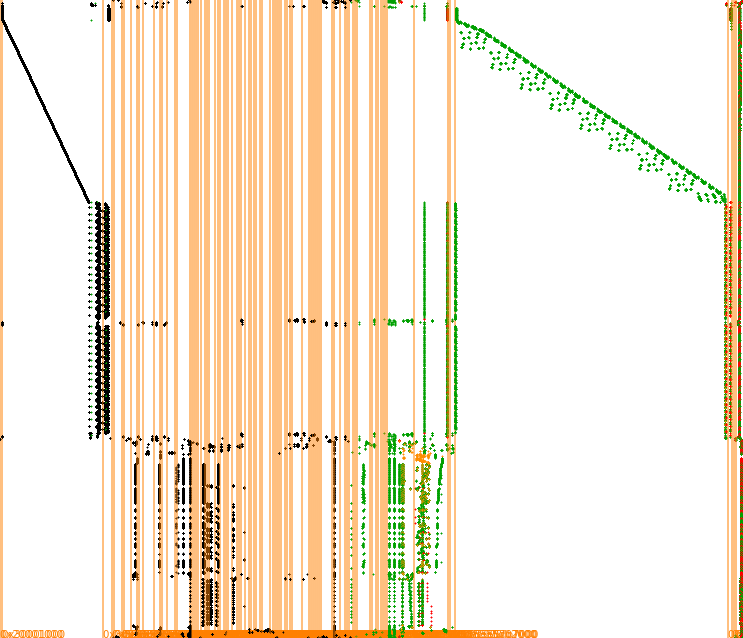
Taking a look at the traces plot of the original Deadpool paper, it seems that the technique filters and provides the same pattern for the original whitebox crypto challenge.
The code and implementation of our Pintool can be found at https://github.com/Jacarte/tawasco/tree/main/host_based/tracer
Disclaimer The plots are obtained using the TracerGraph tool https://github.com/SideChannelMarvels/Tracer/tree/master/TraceGraph. I collect the traces in the same format needed to perform the Deadpool attack and therefore, their plotting.